DE
 FR
 IT
 العربية


Contents 4
The latest insurance market report from FINMA shows, in exemplary fashion, how a supervisory authority underpins a resilience statement with concrete key figures. FINMA attests that the Swiss insurance industry is in a strong financial position and supports this with an aggregated annual result, an increased solvency ratio and a higher capital ratio. For governance, risk and compliance officers, it is worth examining the underlying logic of these key figures. It shows what level of documentation a robust resilience statement requires within their own organisation.
FINMA bases its assessment of the resilience of the Swiss insurance industry on an aggregated annual result of CHF 24.4 billion, 136 percent above the previous year, as well as on a significantly increased capital and solvency ratio. The main driver was investment income, not premium business. For internal documentation, this means that key figures require a calculation basis, a data source and a time series, not just a final number.
Which figures support FINMA's statement on industry resilience?
FINMA attests that the Swiss insurance industry is overall in a strong financial position and supports this with an aggregated annual result of CHF 24.4 billion, which is 136 percent above the previous year’s figure.
In addition, the supervisory authority notes that the industry significantly increased its capital and solvency ratio during the reporting year. For FINMA, this combination of result, solvency and capital development forms the evidence base on which the assessment of industry resilience rests.
The result was driven primarily by investment income: investment profit rose by 47.6 percent to CHF 24.8 billion, and the return on capital investments climbed from 3.37 to 5.00 percent.
Within the segments, the increase in profit was strongest among non-life insurers, at CHF 12.9 billion, and among reinsurers, at CHF 9.8 billion.
Why does premium volume remain almost unchanged despite record profit?
The industry’s total gross premium volume fell only slightly in 2025, by 0.6 percent, to CHF 149 billion, while profit figures improved significantly over the same period.
A look at the individual segments reveals a mixed picture: life insurers grew by 3.7 percent and non-life insurers by 2.8 percent, while reinsurers had to accept a decline of 6.1 percent. FINMA attributes this primarily to the strength of the Swiss franc against the dollar, the euro and the pound.
For the interpretation of the resilience statement, this means that a single figure such as the aggregated annual result explains little unless it is linked to premium development, segment logic and exchange rate effects. How granular a review of key figures should be within internal risk management is described in the article Risk management serves goal achievement, not itself.
What does this key-figure logic mean for documentation within an organisation?
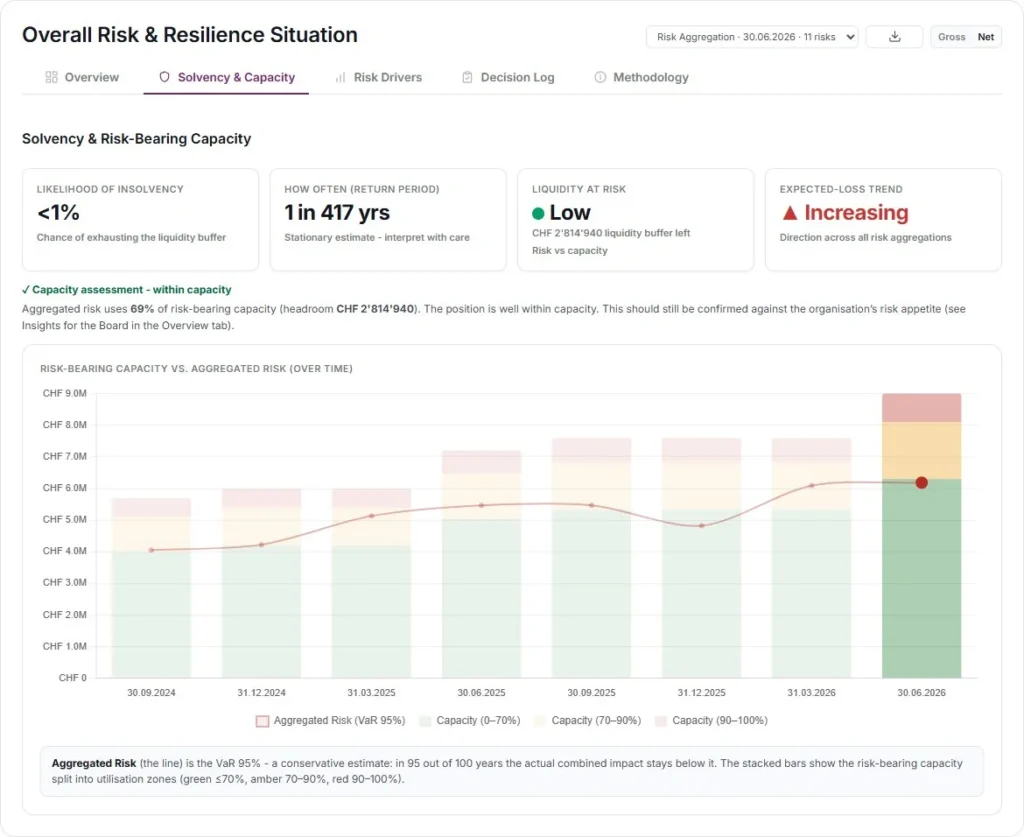
Anyone who wants to justify a resilience statement internally with the same rigor as FINMA does in its report must document not only the figure itself, but also the calculation basis, data source and time series.
The article ERM Report 2023: Financial Resilience in Focus shows that financial resilience in risk management is increasingly treated as a distinct category of key figures, rather than merely as a by-product of the annual financial statements. For governance officers, this means concretely: key figures on financial resilience should be documented in the risk register just as traceably as their calculation logic.
How important seamless evidence over several years is when dealing with supervisory authorities is shown by the article What the UBS fine reveals about long-term supervisory review, using the example of a financial institution.
What first step makes an organisation's own resilience documentation verifiable?
The first step is to bring together the solvency and capital ratios used within the organisation, along with their calculation basis and data source, in a traceable overview.
The risk manager presents this overview at the next meeting of the board of directors or the audit committee, explicitly indicating for which figures a seamless time series exists and where evidence is missing. Such an overview creates the basis for justifying resilience statements within the organisation with a rigor similar to that of FINMA’s insurance market report.
- Record the figure and its calculation basis in the same document
- Clearly assign data source and responsibility for each figure
- Demonstrate a seamless time series across multiple reporting periods
Frequently asked questions
How high was the aggregated annual result of the Swiss insurance industry according to FINMA?
The aggregated annual result stood at CHF 24.4 billion, corresponding to an increase of 136 percent compared to the previous year. The main driver was investment income: investment profit rose by 47.6 percent to CHF 24.8 billion, and the return on capital investments climbed from 3.37 to 5.00 percent.
How did the gross premium volume of Swiss insurers develop?
The industry's total gross premium volume fell slightly in 2025, by 0.6 percent, to CHF 149 billion. Life insurers grew by 3.7 percent and non-life insurers by 2.8 percent, while reinsurers recorded a decline of 6.1 percent, partly due to the strength of the Swiss franc against the dollar, the euro and the pound.
Which segments contributed most to the increase in profit?
The increase in profit was strongest among non-life insurers, at CHF 12.9 billion, and among reinsurers, at CHF 9.8 billion. This increase was driven primarily by the industry's investment income and to a lesser extent by developments in the actual premium business of the individual insurance segments.
What information should internal resilience figures include to be robust?
Internal resilience figures should document not only the final number, but also the calculation basis, the data source used and a seamless time series across multiple reporting periods. Only in this way can a resilience statement within an organisation be justified with a rigor similar to that of FINMA's insurance market report towards the public.
What is the first step in reviewing an organisation's own resilience documentation?
The first step is to bring together all solvency and capital ratios used within the organisation, along with their calculation basis and data source, in a traceable overview. This is then presented to the board of directors or the audit committee, with a clear indication of where seamless time series exist and where the corresponding evidence is still missing.