DE
 FR
 IT
 العربية

Contents 6
- Since when has FINMA regulated interest rate risk in the banking book?
- What did FINMA's ex-post evaluation find?
- What substantive change is driving the partial revision?
- What adjustments does this require for the internal control system?
- How should GRC functions use the consultation period?
- The first step is to compare the existing control catalogue
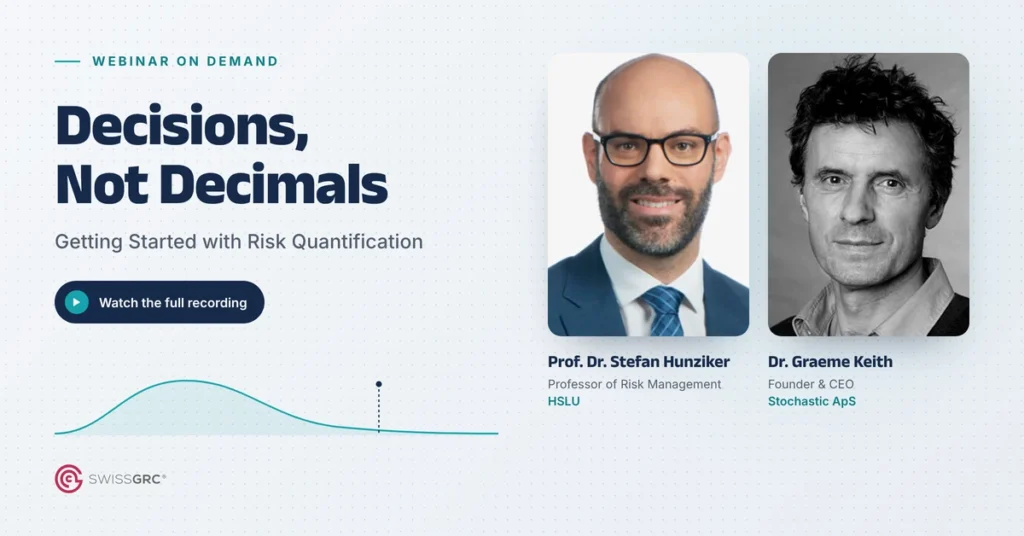
Most risk reports end in a coloured matrix. Far fewer end in a better decision. In our webinar on 13 November 2026, Prof. Dr. Stefan Hunziker of the Lucerne University of Applied Sciences and Arts and the mathematician Dr. Graeme Keith discussed what it takes for risk quantification to actually shape management decisions. Their answer was not a call for more maths. It was a call to start somewhere else entirely: with the decision.
Risk management wears two hats: one shows regulators and auditors that risks are under control, the other helps management decide. Most set-ups are built for the first and judged by the second. Both speakers argued for starting risk quantification with the decision, not the risk register, and for treating it as a precise language for uncertainty rather than a precise number. Missing data is a reason to start small, not a reason to wait.
Watch the webinar
Why does risk information so rarely reach the decision?
Stefan Hunziker opened with a thought experiment. Imagine the risk function were shut down overnight: the register gone, the risk map gone, the annual workshop quietly cancelled. Would anyone notice? The honest test, he said, is whether you can name a decision in the past year where risk management challenged an assumption, shaped the terms or changed the outcome. If not, it may still have done its governance job. Whether it has done its second job is another matter.
That second job is the core of a distinction he uses with boards. Risk management wears two hats, and both are legitimate.
Success: requirements met, a licence to operate
Success: better decisions on strategy, budgets, investments
The trap, in his experience, is that most organisations build risk management for the governance hat and then judge it by the business hat. One CFO put it bluntly to him: management already does risk management, they just don’t call it that, and they don’t need an enterprise risk management on top. “I’m afraid he had a point,” Hunziker admitted. Timing makes it worse: the risk list is updated once a year, while the decisions are taken whenever the business needs them.

Graeme Keith added a point that matters for regulated industries. Regulators have to set a bar that everyone can clear, and the industry then tends to treat that bar as the ceiling. Newer guidance points the other way. He cited Provision 29 of the UK Corporate Governance Code: having a process is not enough, boards have to show that it works. In his view, if the governance hat really worked, the business hat would work too.
What does a heat map hide?
Neither speaker argued for throwing the 5×5 matrix away. As a picture it can work quite well, and in experiments people understand a simple risk matrix about as well as plain text. The trouble starts, Hunziker said, when the picture replaces the analysis and likelihood times impact becomes the assessment itself. Research is fairly clear on two points:
- Scores can rank a smaller risk above a larger one. This has been shown mathematically.
- The words behind the scores mean different things to different people. When five managers agree a risk is “high”, one may be thinking of 20 percent and another of 70. “We agree on a word, but not on the risk,” Hunziker said. He calls it the illusion of consensus.
He made it concrete with a CFO choosing between two investment projects, both rated “medium”.
Same colour, completely different profiles. Which project is right depends on the objectives and on what the company can carry. If a drop of more than 2 percent would break a covenant, B needs a much closer look: how likely is the downside, and can it be protected against? A decision maker never asks how big a risk is. They ask which of the two to take, and why. A single rating cannot answer that.
Why do heat maps persist anyway? They are simple, colourful and fit on one page. And unlearning is hard. Boards have told Hunziker: “You can do whatever you want, but just don’t touch our risk map.”
Why are twenty small risks not a small risk?
Take a register with twenty risks of one kind: a fire in the main plant, a ransomware attack, a product recall. Each has a probability of about 1 percent per year and would cost more than a million francs. On most scales, 1 percent reads as “very low”. Assessed one by one, none of them attracts much attention. Assessed together, the picture changes.
After one year, the chance is already 18 percent, almost one in five. Over a five-year plan it is 63 percent, almost two in three. Nothing about the individual risks has changed. They were only looked at together and over five years instead of one. Telling a board that its five-year plan carries a 63 percent chance of at least one loss above a million francs starts a different conversation. Whether that is acceptable depends on the risk appetite, but it is a question the board should be discussing.
And the calculation is simplified. In reality, risks are often connected, so several can hit at the same time. That is the core problem with qualitative ratings: they cannot be added up, so the most important question stays open. How much can we lose in total, and can we carry it? The portfolio view also works the other way round. Research on managerial decisions suggests that people who judge projects one at a time can become too cautious, even when the company could easily afford those risks as part of its portfolio.
Is missing data a reason to wait with risk quantification?
“We don’t have the data” is the objection both speakers hear most. Graeme Keith called the idea behind it, that data must first be gathered, cleaned and stored in a data lake before analysis can begin, “utter nonsense”. It is not how science works, and it is not how good risk analysis works.
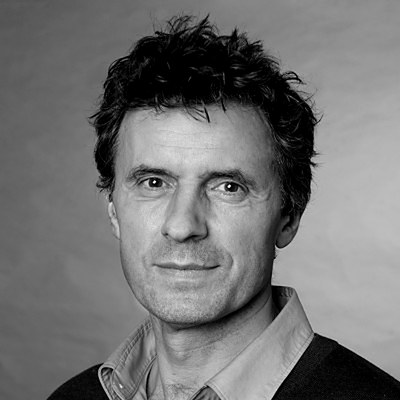
His sequence: start with what you are trying to achieve and the decisions you have to make, then conceptualise what lies on the causal pathway between them. That is the model, and it can be very simple. Only then ask what insight the data you have can give you. Often the first source is already in the building: the estimates people make in risk workshops. Rough, yes. But the aim is not to say a risk will happen exactly so often and cost exactly so much. It is to say it could happen anywhere between nothing and ten times and cost anything from one to a hundred million, and to understand that.
Adding risks up helps here as well. When uncertainties are aggregated for decisions at enterprise level, they get smaller, and extra detail in modelling a single risk gets washed out. Hunziker added the power of small samples: a simple model can start with very little, somebody outside the organisation often has the data already, and models get better as you learn. Keith’s warning about the alternative: companies build “magnificent data lakes” that are useless for the questions that matter, because the things that knock a company off course are exactly the things that haven’t happened yet. For the same reason, he is sceptical of AI for strategic risk: it is trained on what has already happened.
If not the maths, what is risk quantification really about?
Both speakers pushed back on the idea that risk quantification is mainly a mathematical exercise. Keith offered an analogy.
The architect designs the building and decides what it should do. The engineer makes sure it doesn’t fall over in a high wind. The choice of distribution matters, but it is not the starting point, and Monte Carlo, he said, is “20 steps down the road”. First come the objectives, the decisions, the alternatives and the trade-offs, who is involved, what data exists and how much time there is. In his projects, mapping these relationships together with stakeholders is most of the work. People who did the mapping own the model, even if they never see the formulas. More than once, a team realised at the end of the mapping that the answer was already obvious, because one option was in the tens of millions and the other in the hundreds of thousands.
Hunziker came at it from the other side. Numbers are the most precise language we have for uncertainty, but they do not explain themselves. A CFO will never reject numbers, he said, only numbers that don’t help to decide. Research shows that numbers alone rarely change decisions. They need a narrative in business language, linked to goals, thresholds, alternatives and consequences.
In the final minutes, Nikolai Tsenov showed what this can look like in software with RiskQuant on the SwissGRC® Platform: a management overview focused on what has to be decided and on the top risks, an executive summary in plain language on budget, liquidity and solvency, and risk appetite set against risk-bearing capacity. All of it built on the risk register an organisation already has, and none of it requiring a mathematician.
Where should a risk team start?
Asked for practical advice, the two speakers came at it from different angles. Keith works with organisations that already have a process in place, so his starting point is what they are doing today. Sort it into three piles:
Hunziker summarised his advice in five points: distinguish the two hats and put more effort into the business side; start with objectives and decisions, never with collecting risks; let the decision at hand determine whether a quantitative or a qualitative view serves it best; connect risk information to goals, thresholds, alternatives and consequences so that it becomes actionable; and remember that influence is not yet improvement, so measure what risk management actually contributed. Keith added one last myth: you don’t have to do it everywhere at once. Pick the things that matter, support them well and develop from there.
From risk register to board decision
RiskQuant on the SwissGRC® Platform builds on the risk assessments you already have and shows aggregated exposure, risk appetite against risk-bearing capacity and a plain-language summary for management.
Risk QuantificationFrequently asked questions
What is risk quantification?
Risk quantification describes risks in ranges and probabilities, in money, time and likelihood, instead of scores and colours. The aim is not a precise number but a transparent picture of uncertainty that can be added up across risks and compared with risk appetite and risk-bearing capacity.
What does decision-oriented risk management mean?
It means starting with an upcoming decision, such as an investment, a project or a new market, and then asking which uncertainties really matter for it. Those risks are assessed far more carefully and in management language. The aim is not always to change the decision, but to make it with open eyes.
Should we stop using heat maps?
No. Both speakers see a place for the risk matrix as a communication tool and for governance. The problem arises when the picture replaces the analysis. Scores cannot be aggregated and can rank a smaller risk above a larger one, so they should not be the basis for comparing options or setting budgets.
Do we need a lot of historical data for risk quantification?
No. Start by mapping how decisions influence objectives, then ask what you can do with the data you already have, including expert estimates from risk workshops. Small samples are often enough to start, and models improve over time. For strategic risks, long data series rarely exist anyway.
What if model results come with too many caveats to be useful?
This came up in the Q&A. Graeme Keith’s answer: choose the model to fit the question, the data, the time and the stakeholders, not the other way round. If the data cannot support a model, it was the wrong model. And the bar to beat is a 5×5 heat map, which even very little data can improve on.