DE
 FR
 IT
 العربية

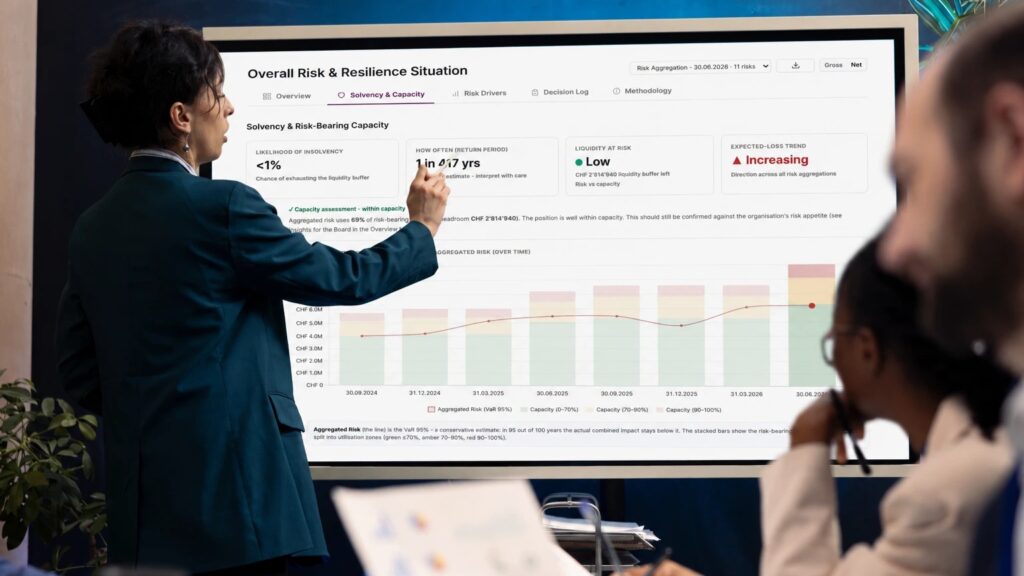
Every risk officer knows the moment. The report is ready: clean, complete, thorough. The board nods, perhaps asks a single question, then moves to the next item on the agenda. And nothing happens. Not because the board does not care, but because the report answered a question the board never actually asked.
Risk is usually reported in the language of risk professionals. Sometimes as a heat map that is hard to draw a firm conclusion from. Sometimes as a quantitative analysis, full of distributions and metrics that almost no one in the room truly reads. Neither is wrong. It simply is not the language a board decides in.
More often than not, it is not the quality of the numbers. The report answered a question the board never actually asked.
A board does not think in risks, it thinks in consequences
The questions actually raised around the table are remarkably simple, and always the same. What could this cost us? How bad does a bad year get? Can we absorb it? How much should we set aside, and how much of that should we insure? And what do we decide today? Good risk reporting is, at heart, nothing more than the discipline of answering that chain, and leaving out everything that does not help. That chain is exactly what we built Board Risk Reporting in GRC Toolbox around.
From the risk register to a number in francs
The starting point is the data already sitting in your risk register. From the frequency and severity of each risk, GRC Toolbox runs thousands of scenarios and aggregates them into a single picture. “Risk XY is high” becomes an amount in francs. That is the depth a simulation gives you. But the depth is not the story, it is only the raw material. It is much like a weather forecast: no one wants to see the raw readings from the measuring stations. They want to know whether to take an umbrella tomorrow.
From a number to a statement that matters
The real work begins after that: drawing from the distribution the few statements that move the board forward. What to expect in a typical year. How far it can climb in a rare but realistic one. And then the step that makes all the difference: holding that risk against the company’s capacity to bear it, which for many of our clients is available liquidity. Only there does an interesting number become a relevant statement. Not “the loss could be high”, but a concrete amount in francs, measured against the company’s buffer.
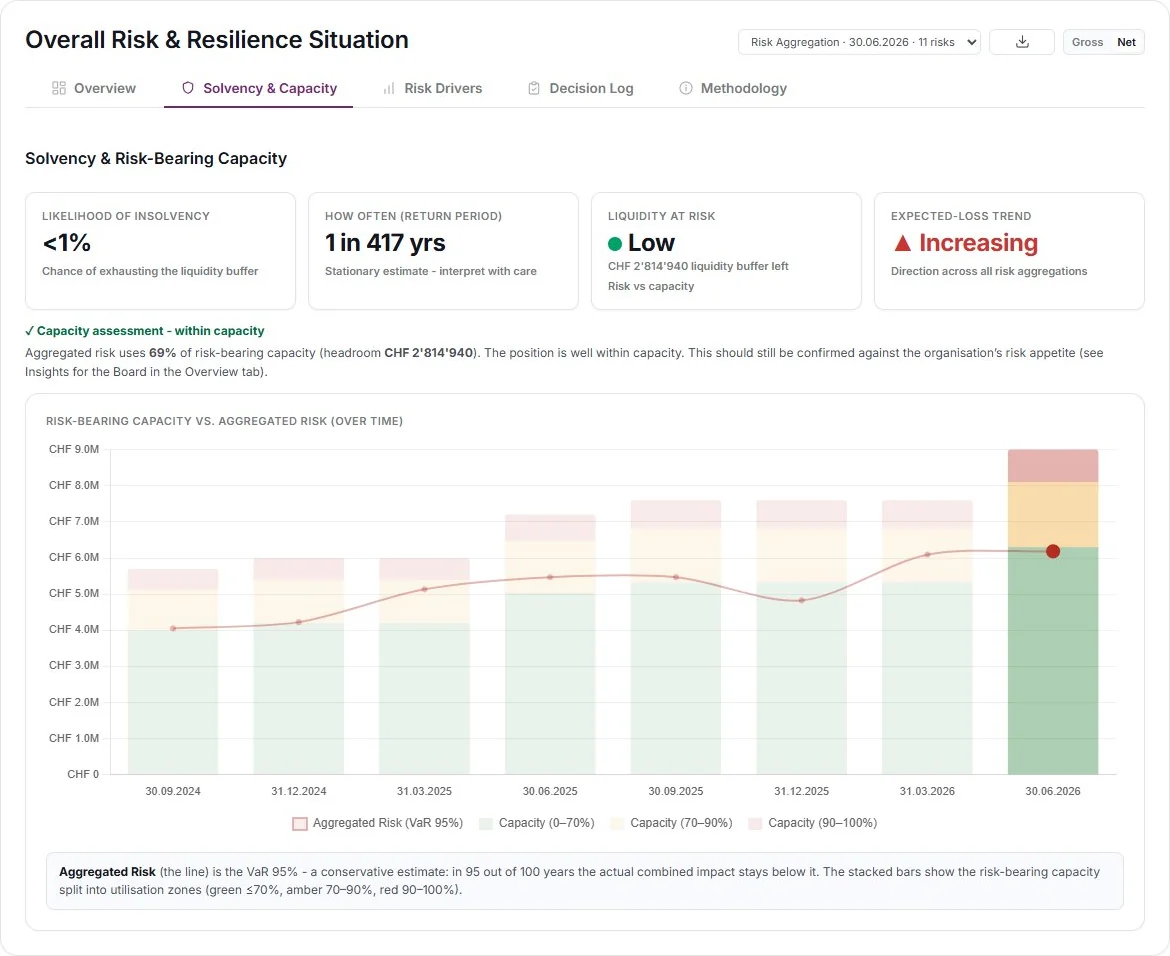
This is what that translation step looks like: aggregated risk set against the liquidity buffer, expressed as a concrete franc amount rather than a traffic light.
The language boards understand
A board rarely decides on risk in the abstract. It decides on budget, on reserves, on insurance, and on which residual risk it is willing to carry. That is precisely the language the report translates the numbers into. The expected annual loss becomes the basis for the reserve to plan for. The gap between the expected loss and a rare, severe year reveals the layer worth insuring or otherwise transferring. And the range beyond that exposes the extreme residual risk that no insurance fully covers. A loss distribution becomes three concrete levers: how much to set aside, what to transfer, and what to knowingly accept.
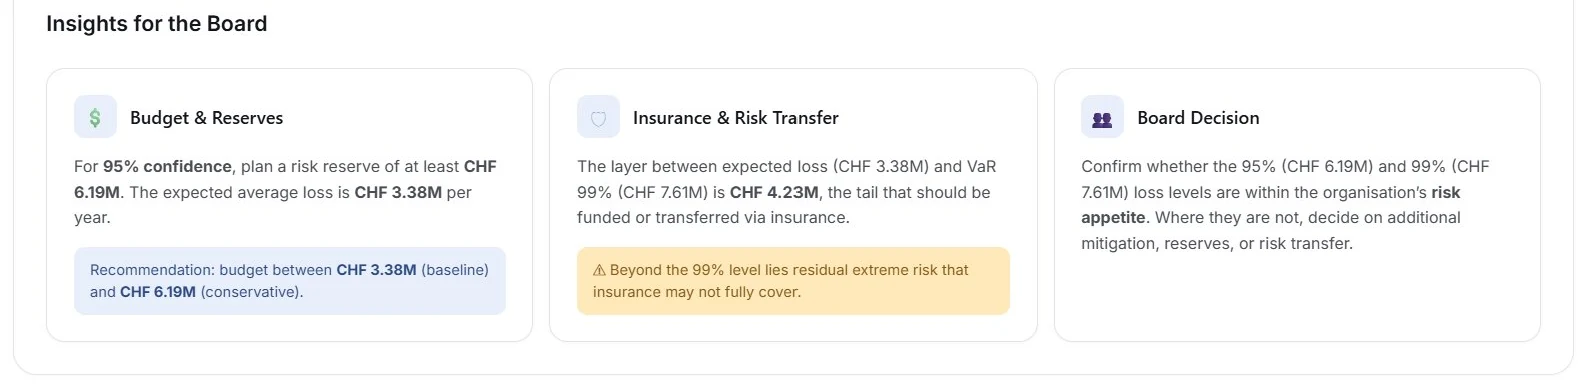
The same numbers, translated into the board’s levers: reserve, risk transfer, and the consciously carried residual risk, checked against risk appetite.
The value lies in what you leave out
The value comes not from what you show, but from what you deliberately leave out.
It is tempting to put all that computing power on display: every histogram, every percentile. But each additional metric the board does not understand costs the very attention the decision needs. So we did not remove the depth, we moved it one level down. Anyone who wants it finds the full methodology, the glossary and the assumptions a single click away. The board page itself stays calm.
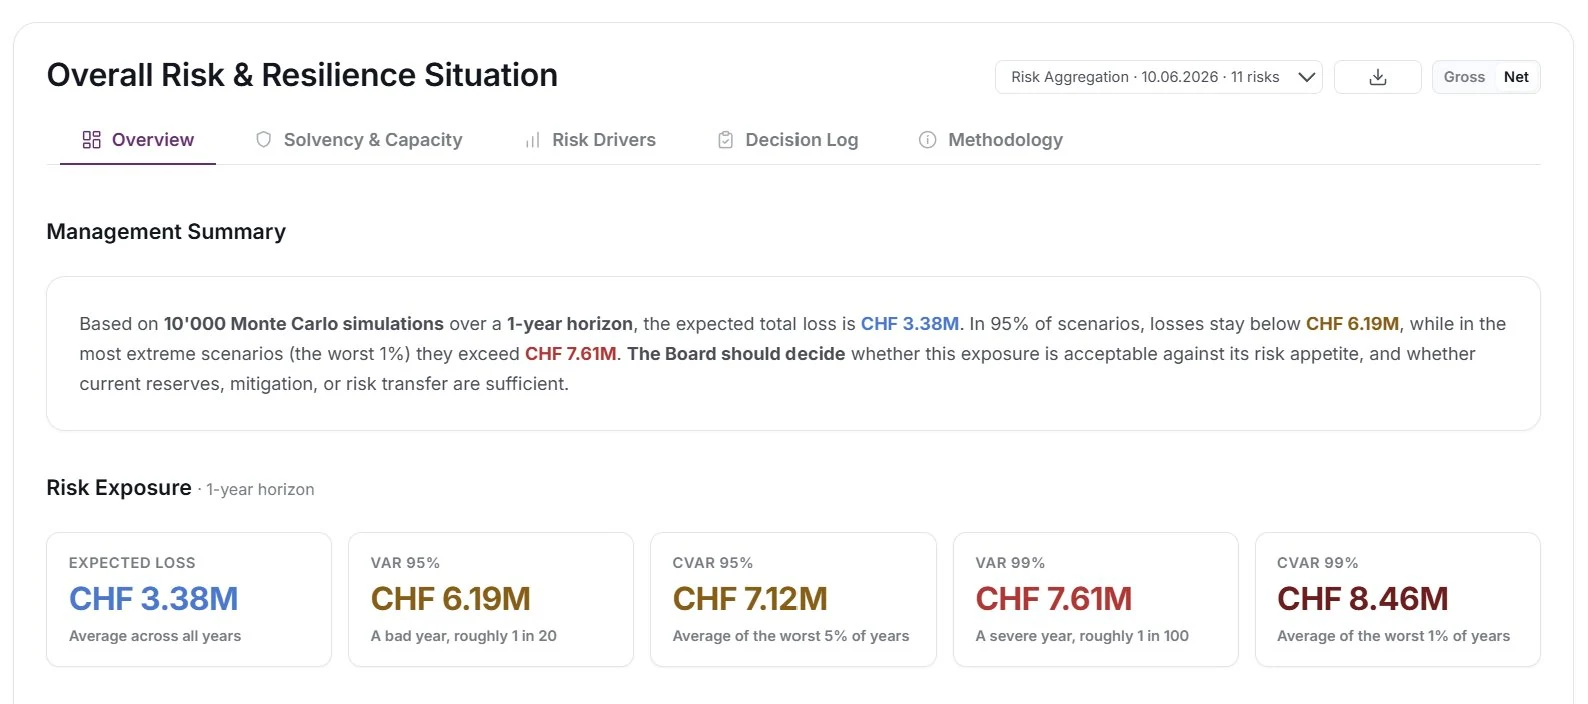
The board page opens with a two-sentence statement, not a chart. The statistics are there, but they do not force themselves on you.
The decision belongs in the report
Then there is the part most reporting tools leave out altogether: the decision itself. A report that records no decision is merely a snapshot. So the board’s decision, the rationale and the resulting actions are captured directly on the same run. Next time, you not only see the new numbers, you also see what was decided last time and whether it worked. That is how reporting becomes a traceable governance trail.
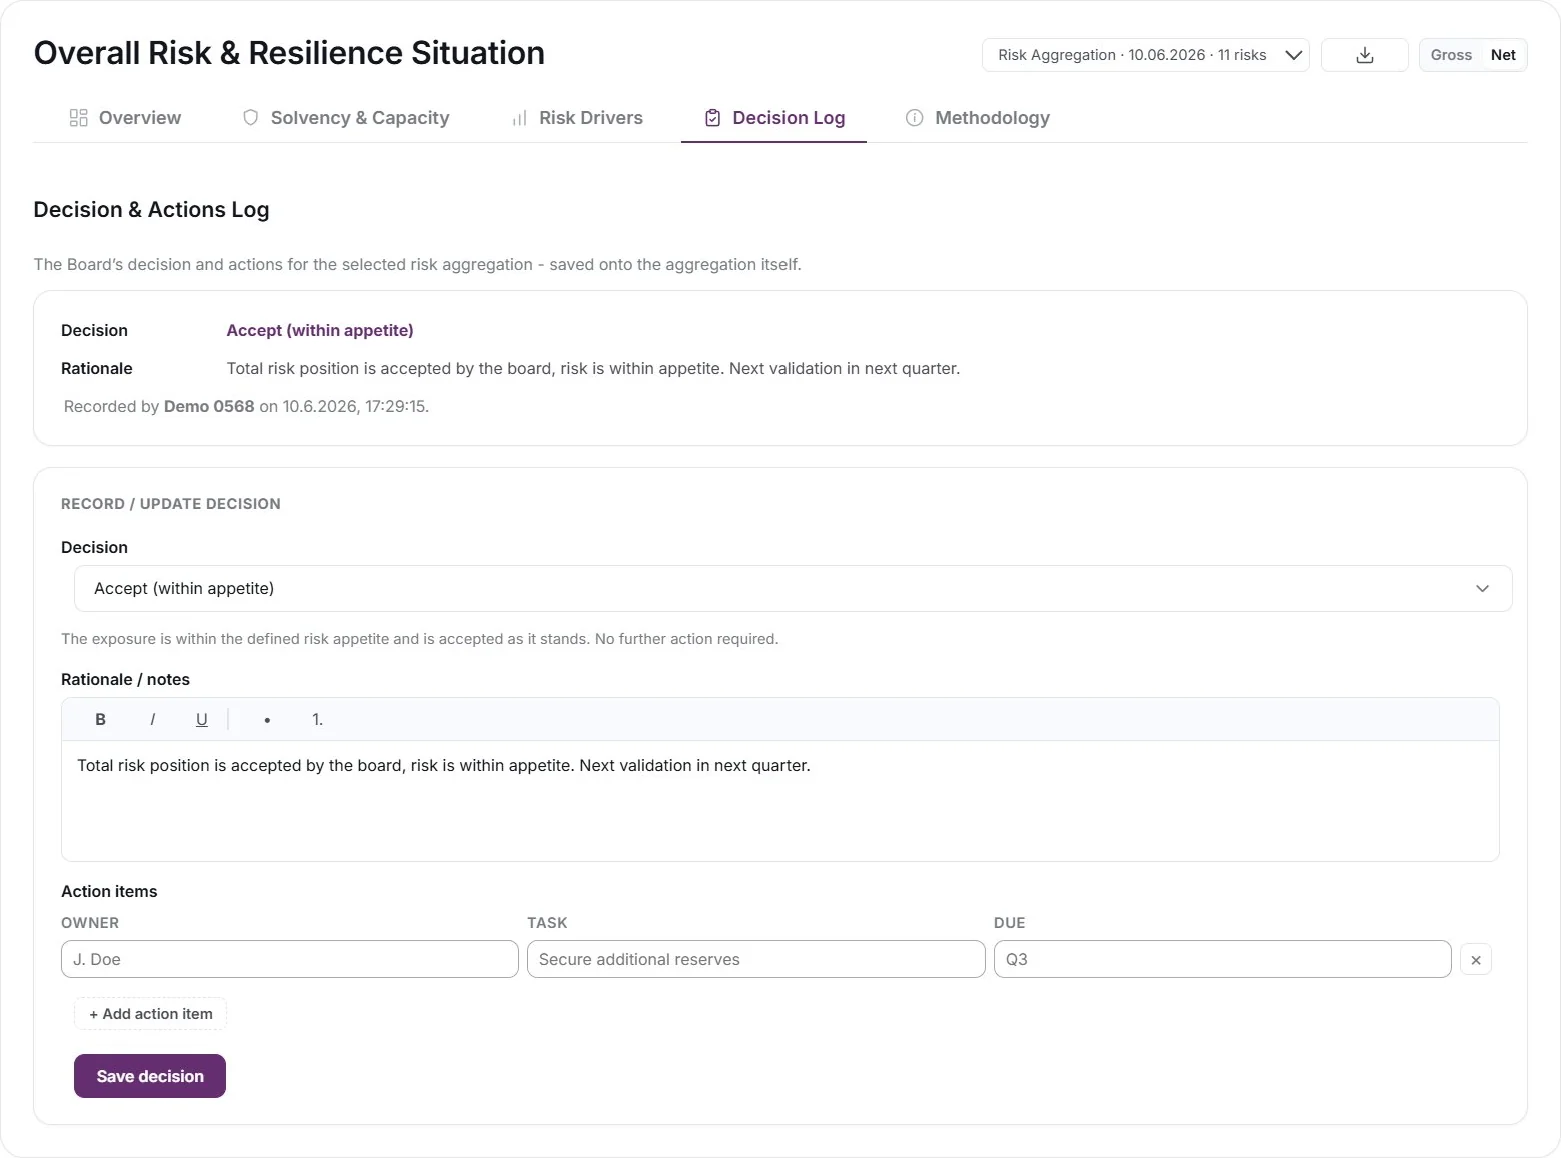
The decision belongs in the report, not in a separate set of minutes. Documented and auditable.
What actually changes
In the end, the change is both smaller and larger than it sounds. Smaller, because the building blocks, simulation, metrics, risk-bearing capacity, are nothing new. Larger, because the perspective turns: no longer “how do we show everything we calculated”, but “what does the board need in order to decide”.
Risk quantification delivers the numbers. Board Risk Reporting turns them into a decision.
Two ways to explore the approach, from simulation to decision.
We walk you through the entire path live, from simulation to decision, with time for your questions.
We show you risk quantification and Board Risk Reporting on realistic data, and discuss how it fits your own risk register.